Articles
| Name | Author | |
|---|---|---|
| From Hotels To The High Seas: Digitizing Passenger Experience At Celestyal | Celestyal and SuitePad | View article |
| Introducing: Lufthansa Industry Solutions’ Digital Twin | Dr. Gerald Däuble, Head of LHIND Digital Twin | View article |
| Ultrabulk Realizes The Human Dividend | Oskar Fabricius, CFO at Ultrabulk | View article |
| A Shipping Business Made Savings And Improved Utilization | Amanda Aho Vanhatapio, Customer Success Manager, Seaber | View article |
| The Changing Maritime Sector | Callum Beaumont, Founder of Cordell Beaumont | View article |
| Keeping It All together For Ambassador Cruise Line | Ryan Simpson, Head of Technology, Ambassador Cruise Line | View article |
| Seacraft IT Takes To The Oceans | Ed Haskey, Director Aircraft IT | View article |
A Shipping Business Made Savings And Improved Utilization
Author: Amanda Aho Vanhatapio, Customer Success Manager, Seaber
Subscribe
Standfirst Amanda Aho Vanhatapio , Customer Success Manager shares how Seaber has increased an operator’s fleet utilization and reduced costs with AI-powered scheduling
Everything in the shipping industry is large and expensive so ensuring that all assets perform to their optimum is very important. In this case study, I want to tell the story of how a major shipping business, by implementing a modern AI-powered schedule planning and fleet optimization solution, has improved the utilization of its vessels and the cost effectiveness of each voyage.

THE CHALLENGES THE OPERATOR FACED
While manual scheduling remains prevalent in shipping, the limits of manual systems limit optimization potential as figure 1 illustrates.

Figure 1
In that vein, a tanker operator approached Seaber with a challenge that resonates across the maritime industry: their voyage planning and fleet optimization processes were entirely VMS (Voyage Management System) and spreadsheet-based, as is the case for many shipowners and charterers in the bulk, tanker and breakbulk industry. Despite strong internal capabilities, the customer suspected that better results would be possible if data could be analyzed more dynamically. In particular, they were looking for a way to:
- Increase vessel utilization;
- Reduce the total cost of operations (daily costs, port, and bunker);
- Improve the percentage of laycans met;
- Determine whether their current fleet size was appropriate.
The chartering team was open to testing new technology, but only if the value could be proven convincingly and practically, with real data and realistic constraints. With a fleet of interchangeable vessels and around 40 to 50 voyages over a typical three-month period, their planning was constrained by human limits: too many variables, too little time, and a persistent assumption that ‘it’s already optimized.’ The results in this study show how we used the customer’s benchmark and created various scenarios in the Seaber platform to identify vast savings.
THE OBJECTIVE
The shipping company wanted to prove that AI-powered scheduling can outperform Excel. The objective was to validate whether Seaber’s AI-powered scheduling and planning tool could deliver measurable improvements over the operator’s traditional approach. Specifically, the charterer wanted to:
- Benchmark their original schedule against scenarios generated by Seaber;
- Maintain key operational requirements such as agreed laycans, cargo compatibility, and port restrictions;
- Determine the impact of adjusting constraints, such as allowing small delays or re-letting cargoes;
- Estimate cost and efficiency gains based on validated historical data;
- Use results to inform future chartering decisions, especially regarding long-term charters.
A COLLABORATIVE APPROACH
Seaber was asked to structure a practical study around these goals while ensuring transparency and reliability throughout the process. The methodology used in the study was co-designed with the customer to ensure it accurately represented their reality. Every assumption, constraint, and scenario was reviewed and agreed upon in advance. This collaborative approach ensured that the outcomes were not only reliable but also validated by the customer as a legitimate benchmark against their original approach. Figure 2 shows the drag-and-drop functionality of the Seaber tool that makes planning easy and quick.
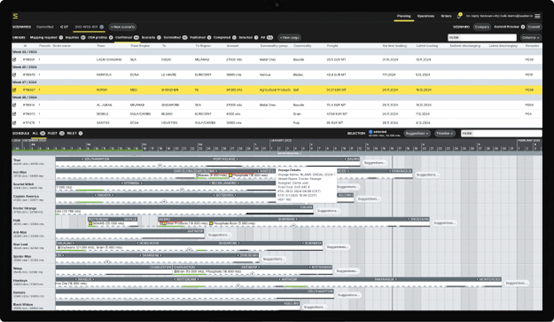
Figure 2
THE PROCESS
In order to inform the new solution, historical data needed to be turned into optimized scenarios and that was achieved with four steps.
Step 1: Data preparation and focus period selection
The operator provided detailed records of historical voyages. A three-month period with about 40–50 voyages was selected to create a manageable yet representative test set. Seaber reformatted this data, clarified planning assumptions, and built a custom cargo import template to streamline data integration.
Step 2: Scenario mapping
Using the customer’s original plan, Seaber replicated the full schedule inside the platform, creating a baseline scenario. This allowed a direct, side-by-side comparison between the status quo and the new optimized versions.
Step 3: Seaber optimization process
Seaber then used its built-in scheduling tool to generate alternative scenarios. These included:
- Scenario 1: Allowing short delays to increase flexibility;
- Scenario 2: Minimizing delays, but still with some tolerance;
- Scenario 3: No delays accepted.
Step 4: Interpretation and review
The Seaber team worked closely with the customer to review each result. Potential violations of laycan were individually assessed and accepted or rejected based on operational priorities. This collaborative step was essential to ensure the results aligned with real-world feasibility.
OUTCOME
The flexibility in the Seaber system enhances planning and reduces costs. To illustrate how users can use flexibility to optimize the specific voyages, here are two best case scenarios.
Best case: Scenario 1 with short delays allowed created 8.3% cost savings as shown in figure 3.
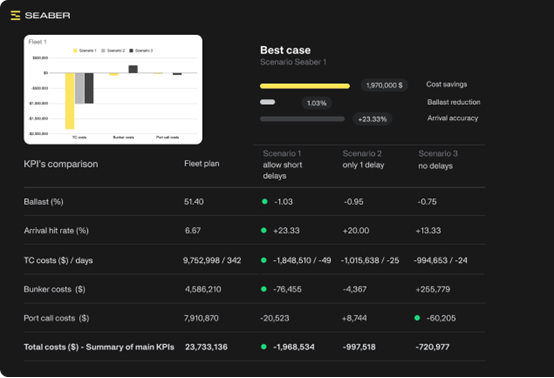
Figure 3
These scenarios proved that modest changes in flexibility, like allowing brief delays, could significantly enhance planning without major operational disruption. Seaber’s alternative planning demonstrated the potential to free up 49 vessel days while transporting the same cargoes as in the benchmark case. Allowing short delays of less than a day reduced ballast and bunker costs, delivering meaningful savings while also lowering CO₂ emissions, in line with the industry’s drive to cut climate impact. Even in the strictest ‘no delays’ scenario, a 3% cost saving was achieved, already a significant business impact. By introducing short delays, the potential for even greater efficiency and sustainability gains became evident.
Best case: Scenario 2 shows how smart timing and re-letting optimized fleet utilization and, with short delays allowed, created 4.2% cost savings as in figure 4.
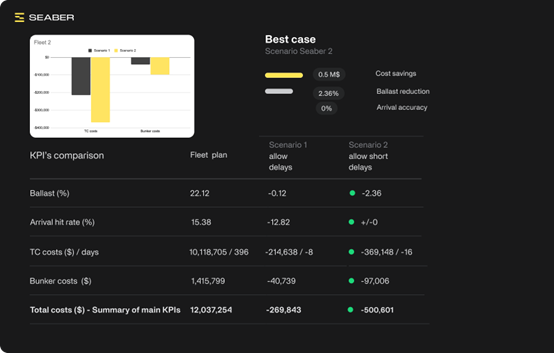
Figure 4
These scenarios proved that modest changes in flexibility, like allowing brief delays, could significantly enhance planning without major operational disruption. Notably, short delays of less than a day delivered better results than delays of 1–2 days. Other options we have reviewed include re-letting a small number of cargoes that could free up vessels and reduce idle sailing. Re-letting cargoes allows for more efficient vessel utilization by reducing unproductive sailing and minimizing associated costs. It also provides flexibility to adapt to market conditions. The results indicated that fewer internally controlled vessels might be needed in the long term with more efficient planning. From a chartering perspective, depending on the type of market factor, reducing the size of the own fleet could result in lower operational costs, and more flexibility to seize market opportunities.
FEEDBACK
The customer’s reaction was highly positive, both in terms of methodology and results:
- They appreciated that the results were grounded in their historical data and reflected realistic constraints.
- One key insight was that their existing fleet size might be larger than necessary, and the study could guide future fleet sizing and renewal strategies.
- They also noted that actual cost savings could be even higher with access to complete financial data.
KEY LEARNINGS
There were a number of clear and useful takeaways that came out of the project.
- Clarity is critical: Clear voyage rules, cargo-vessel compatibilities, and delay thresholds helped build a robust model.
- Flexibility brings value: Introducing small allowances (e.g., for delays) creates optimization space with high payoff.
- Utilizing market vessels unlocked major gains: using the spot market for marginal cargoes improves both cost and fleet availability.
- Cost focus is pragmatic: Even without precise market pricing, bunker, TC, and port costs provide meaningful performance indicators.
- AI supports, not replaces, experts: Human review of Seaber’s suggestions was vital for operational realism.
- Simple visualization: The intuitive user interface is a key enabler of optimization, clearly presenting AI-powered results in a way that empowers planners to act immediately, without added complexity.
FROM PROOF-OF-CONCEPT TO STANDARD PRACTICE
This anonymized case study demonstrates how a digital planning tool like Seaber can challenge the ‘optimized by default’ mindset with hard data and credible alternatives. The customer now views the platform as a strategic planning partner, not just a scheduling tool.
Future goals include:
- Testing live planning scenarios with market cargoes;
- Expanding the platform to support spot freight decisions;
- Using results to inform TC renewal negotiations.
By adopting AI-powered scheduling, this operator is no longer constrained by spreadsheets. Instead, they’re gaining new insights, reducing costs, and making smarter fleet decisions, one voyage at a time. As the customer’s representative put it, “This is exactly the approach I wanted to see. The industry always says: ‘We can’t do it differently, it’s already optimized.’ But this shows that we can do better.”
To put that into numbers, our customers are proven to save 3-8% in operating costs.
Comments (0)
There are currently no comments about this article.
To post a comment, please login or subscribe.